Finding a Setting
The Swarm Settings and Swarm Behavior Profile inspectors hold a lot of fields. A bar at the top of both gives you three ways to cut through them: search by word, show only the performance-heavy settings, or show only the ones that have been changed. All three are inspector aids, and none of them alter your configuration. The performance rating the second one filters on is shown on the fields themselves, as the colored dots described below.
Search by word
Type into the search box and matching fields appear as a flat list under breadcrumb labels like Circling & Strafing ▸ Orbit Style. Results span both Simple and Advanced, so you never have to open a section by hand to find what is inside it.
Matching reads four things per field: its label, its tooltip text, a set of plain-language terms for the problem it solves, and the reason text behind its performance rating. Those problem terms let you search by symptom instead of field name: "jitter" or "falls through floor" in Swarm Settings, or "melee", "kite", or "regroup" in a Behavior Profile, each land on the right field. Extra words narrow the results, and matching ignores case.
Nothing matching?
Try a plainer word. The box reads tooltip text and problem terms, not only field names, so describing what you want often works better than guessing the exact label.
What the colored dots mean
Most Massive Swarm System inspectors rate their settings for performance impact, and the small dot to the left of a field is that rating. Section headers carry one too, for the behavior or subsystem the section switches on. Where an inspector has rated fields, a Performance Impact card near the top usually names the three ratings:
| Dot | Rating | What it means |
|---|---|---|
| Green | Low | Localized or occasional work. |
| Amber | Medium | Scales with scene complexity or active agents. |
| Red | High | Strong scaling cost in large swarms. |
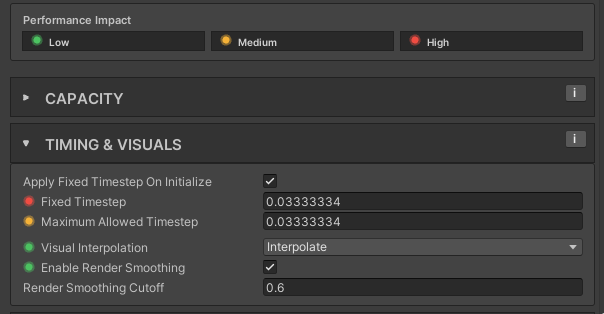
The card shows the names only. The meanings in the table above are the tooltips on its three chips, so hover one to read it in the Editor. The i button on any section header turns descriptive text on throughout the inspector, and the card gains a line of its own with it.
A field's dot has a tooltip of its own, and it goes further: it names the rating, then says why that particular field earned it. Max Agents reads as Directly scales simulation loops, memory allocation, visual instances, and most per-agent systems. Ground Probe Interval reads as Spreads ground physics probes across fixed steps. Higher values reduce per-step query count but add grounding latency. Read the reason before changing a red field, because it usually tells you which direction is the expensive one.
A rating describes how a setting scales, not whether you are allowed to touch it. Red means the cost of this one climbs with the size of the swarm, so measure after you change it. A field with no dot carries no rating, which is the common case: most settings change behavior rather than cost.
Dots show in Simple mode as well as Advanced. The card at the top hides itself while a search or a filter is running, to give the results room, and comes back once the box is empty and both chips are off.
Show only performance-heavy settings
The High Impact chip narrows the list to the settings rated High performance impact, the levers whose cost climbs most as the swarm grows. Turn it on to audit everything that could get expensive at 1000+ agents. It combines with the search box, so you can scope High Impact to one area by typing alongside it.
Show only changed settings
A blue bar in the left margin marks fields whose value differs from the factory default, the value a brand-new asset starts with. The Non-default chip filters the inspector down to just those fields, the quickest way to see everything you have tuned. Right-click a marked field and choose Reset to Factory Default to put it back.
The bar and the right-click reset are for ordinary fields. The ON/OFF pills that sit on section headers and nested foldouts are drawn differently and carry neither, so a behavior you switched on shows no blue bar while you are browsing. Turn on a filter and it gains both, because filtered results redraw those pills as regular rows.
Presets show as non-default on purpose
The baseline is the factory default, not the values a preset happened to ship with. The ready-made preset assets are tuned deliberately, so opening one shows blue bars on the rows it changed. That is the marker doing its job, telling you what the preset tuned, not a sign that anything is wrong.
The three controls stack. Combine the search box, High Impact, and Non-default to answer a specific question (say, which performance-heavy settings you have changed) in a single view.